2026-05-27 Market Briefing| Nasdaq 26,656, Brent $94.25, Drewry WCI $2,712


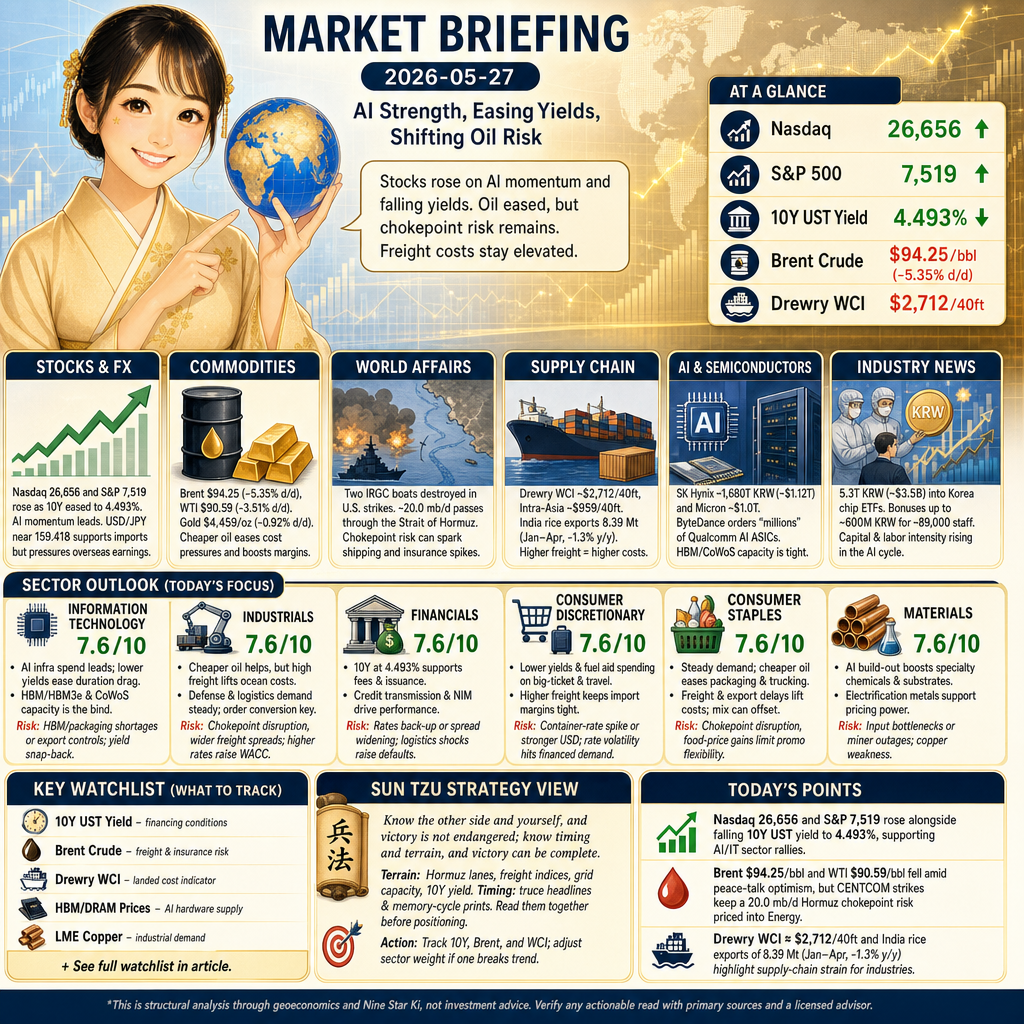
Good morning — AI strength, easing long yields, and shifting oil risk set today’s tone. Nasdaq 26,656 and S&P 7,519 rode a 10Y at 4.493% as Brent slid to $94.25. Freight costs (Drewry WCI ~$2,712/40ft) remain the sticky input. The read ties together rates, shipping chokepoints, and AI hardware demand across power and real estate.
Stocks and FX
Nasdaq closed 26,656 and the S&P 500 7,519 as the 10Y UST eased to 4.493% and the 30Y to 5.026%, with USD/JPY near 159.418, per Reuters (via Investing.com) and market tape. AI momentum led gains, tightening the link between valuations and long‑duration rates. A firm dollar supports U.S. buying power for imports but can pressure overseas earnings translation. Lower yields ease discount‑rate drag for IT and Communication Services, while Financials track curve shape for fee/NIM dynamics.
Commodities
Brent fell to $94.25/bbl (‑5.35% d/d) and WTI to $90.59/bbl (‑3.51% d/d), while gold printed $4,459/oz (‑0.92% d/d), per Reuters. One‑week crude declines near 15% show rapid risk‑premium compression tied to truce hopes. Cheaper crude lowers fuel, packaging, and freight inputs, easing headline inflation pressure and supporting margins in Industrials and Consumer sectors. Insurance premia on exposed routes still matter for landed costs.
World Affairs
Two IRGC boats were destroyed in U.S. strikes and ~20.0 mb/d normally transit the Strait of Hormuz, Reuters/MarketScreener note. Direct action near a chokepoint raises the odds of episodic shipping disruption and higher insurance. That volatility feeds into Energy input costs, container/tanker spreads, and credit risk premia that Financials and Industrials must price. Markets will toggle between truce headlines and logistics reality.
Supply Chain
Drewry’s World Container Index is near $2,712 per 40ft and its Intra‑Asia gauge about $959 per 40ft, while India’s rice exports were 8.39 Mt in Jan–Apr (‑1.3% y/y), per Drewry and Reuters. Higher spot rates and delays lift landed costs and lengthen lead times. Retailers and staples face tighter working‑capital cycles and may rebalance routes and inventory buffers. Development costs edge up for projects with heavy imported materials.
AI
SK Hynix touched ~1,680 trillion won (~$1.12T) and Micron briefly ~$1.0T in market value, while Bloomberg reported ByteDance ordering “millions” of Qualcomm AI ASICs — alongside the Nasdaq at 26,656, per Reuters/MarketScreener and financial press. HBM/HBM3e and CoWoS capacity are the constraints, not demand, supporting higher component ASPs. This channels capex to semis, memory, equipment and raises downstream power and data‑center needs for Real Estate and Utilities.
Industry News
About 5.3 trillion won (~$3.5B) of flows into Korea chip ETFs and prospective bonuses up to ~600 million won for a workforce reported near 89,000 illustrate capital and labor intensity in the AI cycle, per Reuters/MarketScreener and industry press. UBS upgrades helped lift Micron to ~$1.0T, while SK Hynix hit ~1,680 trillion won. Elevated wage/SGA and potential labor strains can tighten supply even as cash flows improve, shaping margins and throughput for Information Technology and Materials, and fee flows for Financials.
Industry Forecast
Today's Setup
2026-05-27 is a Five Yellow Earth (Goou Dosei, 五黄土星) day with the month also Five Yellow Earth, both sitting at the Center (Chūkyū, 中宮) during Rikka (Beginning of Summer). Control points decide outcomes: policy rates, logistics hubs, compute and power capacity. The year’s One White Water (Ippaku Suisei, 一白水星) adds a flow backdrop — liquidity, information routing, and shipping lines. Translation: watch the 10Y yield for financing conditions, Drewry’s WCI for landed costs, and oil for freight/insurance risk.
Focus Sectors
- Information Technology (7.6/10): AI infrastructure spend is the driver as SK Hynix (~$1.12T) and Micron (~$1.0T) signal strong memory demand; lower 10Y at 4.493% eases duration drag. That supports semis, memory, equipment and services tied to HBM/HBM3e and advanced packaging (CoWoS), with capacity, not demand, as the bind. Risk: HBM/packaging shortages or export‑control shifts defer shipments and raise costs; a yield snap‑back would re‑price long‑duration earnings. Watch memory contract ASPs and delivery schedules.
- Industrials (7.6/10): Freight is the hinge: Drewry’s WCI (~$2,712/40ft) lifts ocean costs, while cheaper oil trims diesel/jet, improving logistics margins. Defense and specialized logistics see steady demand with CENTCOM activity near Iran. That mix supports order conversion where supplier delivery times improve. Risk: chokepoint disruption widens freight spreads and delays revenue; higher rates would raise WACC and slow capex‑heavy projects. Monitor ISM Supplier Deliveries and fuel basis for short‑cycle swings.
- Financials (7.6/10): The 10Y UST at 4.493% and active AI‑led equity flows support fee income and issuance, while easing duration stress helps marks. Credit transmission is the gate: lending standards and loan demand will steer net interest margin (NIM, the spread banks earn between loans and deposits). Trade‑finance and insurance premia remain sensitive to Hormuz risk. Risk: a sharp rates back‑up or spread widening would hit NIM and trading; logistics shocks could lift defaults at exposed shippers.
- Consumer Discretionary (7.6/10): Lower yields (10Y 4.493%) and softer fuel help big‑ticket financing and travel/leisure costs, while WCI (~$2,712/40ft) keeps import margins tight. Where inventory turns are disciplined, operating leverage can re‑emerge as sales outgrow fixed costs. Risk: a renewed container‑rate spike or stronger USD raises import costs and squeezes promotions; sudden rate volatility would curb financing‑led demand. Watch retail sales cadence and freight spreads for margin headroom.
- Consumer Staples (7.6/10): Food and household chains face higher ocean freight (WCI ~$2,712/40ft) and some export delays (India rice 8.39 Mt, ‑1.3% y/y), while cheaper oil eases packaging and trucking. Steady demand plus mix/private‑label can offset logistics volatility as contracts reset. Risk: further Hormuz/Red Sea disruption lifts insurance and creates inventory gaps; global food‑price gains would limit promotional flexibility. Track procurement baselines and shipment reliability for margin normalization.
- Materials (7.6/10): AI build‑out pulls specialty chemicals, gases and substrates while lower oil softens petrochemical feedstock costs. Metals for electrification and data centers (copper/aluminum) steer pricing power as ocean freight creeps up. That supports real‑asset exposure with growth linkage. Risk: bottlenecks in high‑purity inputs or miner outages push costs up just as downstream orders accelerate; sharp copper drawdowns would flip bargaining power to suppliers. Watch LME copper prices and warehouse stocks.
Watchlist
- Consumer Discretionary: U.S. Census Monthly Retail Trade Report (monthly nominal sales by category — a direct read on discretionary demand and inventory cadence).
- Consumer Staples: FAO Food Price Index (monthly global food commodity prices — a direct input to procurement cost baselines).
- Financials: Federal Reserve SLOOS (Senior Loan Officer Opinion Survey — quarterly lending standards and loan demand across C&I and consumer).
- Industrials: ISM Manufacturing Report on Business — Supplier Deliveries Index (monthly delivery‑time changes that signal supply‑chain tightness).
- Information Technology: TrendForce DRAM (including HBM) contract price index (monthly contract ASPs for memory — a direct read on AI hardware supply/demand balance).
- Materials: London Metal Exchange Copper 3‑month price and warehouse stocks (daily — a proxy for industrial and electrification demand/supply tightness).
- Communication Services: Standard Media Index (SMI) monthly ad spend reports (agency billings by channel — a timely read on advertising demand).
- Energy: EIA Weekly Petroleum Status Report (weekly U.S. crude/product inventories and refinery utilization — gauges near‑term supply/demand balance).
- Health Care: FDA CDER monthly drug approvals (chemical and biologics approvals — a direct read on pipeline conversion to revenue).
- Real Estate: U.S. 10‑Year Treasury Yield (U.S. Department of the Treasury daily — the base input to cap‑rate and valuation models).
- Utilities: EIA Electric Power Monthly (utility‑scale generation, capacity additions, and fuel mix — confirmation of load growth and investment pace).
Caveats
A rapid reversal in ceasefire prospects or new strikes near Hormuz would flip oil, freight and insurance, changing today’s cost and valuation read quickly. A sharp jump in the 10Y UST or a surprise surge in Drewry’s WCI would tighten financing and margins more than the current center‑of‑system setup implies.
Sun Tzu Strategy View
Sun Tzu wrote: —— Know the other side and yourself, and victory is not endangered; know timing and terrain, and victory can be complete.
Today’s “terrain” is literal and financial: shipping lanes through Hormuz, freight indices, grid capacity, and the 10Y yield. Pair that with timing from truce headlines and memory‑cycle prints to judge where costs and capital are moving. Read those together before leaning into rate‑sensitive growth or logistics‑exposed margins.
Action: Track 10Y UST 4.493%, Brent $94.25, and Drewry WCI $2,712; adjust sector weight only if one breaks trend with confirmation.
Today's Points
- Nasdaq at 26,656 and S&P 500 at 7,519 rose alongside falling 10Y UST yield to 4.493%, supporting AI/IT sector rallies.
- Brent $94.25/bbl and WTI $90.59/bbl fell amid peace‑talk optimism, but CENTCOM strikes (two IRGC boats reported destroyed) keep a 20.0 mb/d Hormuz chokepoint risk priced into Energy.
- Drewry WCI ≈ $2,712/40ft and India rice exports of 8.39 Mt (Jan–Apr, ‑1.3% y/y) highlight supply‑chain strain that will affect Consumer Staples, Industrials and retail margins.
This is structural analysis through geoeconomics and Nine Star Ki, not investment advice. Verify any actionable read with primary sources and a licensed advisor.